SCIENTIFIC PROGRAMME
SESSION I
BIOLOGY OF B-CELL
PRECURSOR ALL
SESSION II
BIOLOGY OF T-CELL ALL
SESSION III
MINIMAL RESIDUAL
DISEASE MONITORING
SESSION IV
INDIVIDUALIZED
MANAGEMENT OF ALL
SESSION V
NEW ADVANCES IN ALL
SESSION VI
CAR T-CELLS &
ALLOGENEIC HSCT
SESSION VII
FRONTLINE
INCORPORATION OF
BITES AND ADCS
SESSION VIII
T-CELL ALL AND
LYMPHOBLASTIC
LYMPHOMA
SESSION IX
PH AND PH-LIKE ALL
SELECTED ABSTRACTS
FOR AN ORAL
PRESENTATION
SELECTED ABSTRACTS
AS E-POSTERS
DISCLOSURES
related toxicity (15% vs. 38%). No differences were observed in OS among pts with isolated t(1;19) and
those with t(1;19) with ACA (5y-OS 59% 23%-95% vs. 33% 1%-65%, p=0.645). A significantly higher
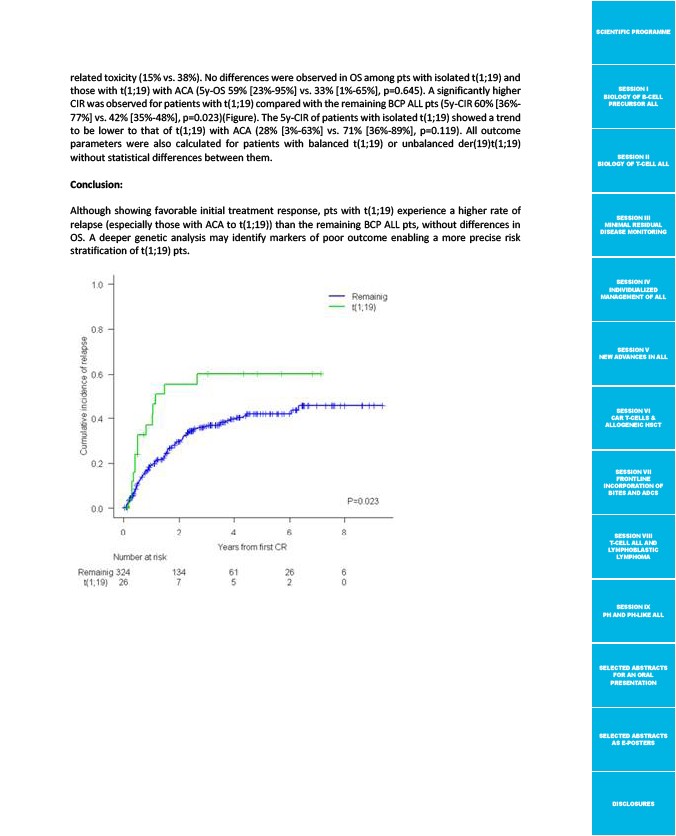
CIR was observed for patients with t(1;19) compared with the remaining BCP ALL pts (5y-CIR 60% 36%-
77% vs. 42% 35%-48%, p=0.023)(Figure). The 5y-CIR of patients with isolated t(1;19) showed a trend
to be lower to that of t(1;19) with ACA (28% 3%-63% vs. 71% 36%-89%, p=0.119). All outcome
parameters were also calculated for patients with balanced t(1;19) or unbalanced der(19)t(1;19)
without statistical differences between them.
Conclusion:
Although showing favorable initial treatment response, pts with t(1;19) experience a higher rate of
relapse (especially those with ACA to t(1;19)) than the remaining BCP ALL pts, without differences in
OS. A deeper genetic analysis may identify markers of poor outcome enabling a more precise risk
stratification of t(1;19) pts.